Jupyter Widget Usage
Note: Python 2.7 is dropping support January 1, 2020. For this reason, Mango no longer supports Python 2.
The Mango widgets are Jupyter widgets built using pileup.js. The widgets support visualizations for alignments, features, variants, and genotypes in a Jupyter Notebook and Jupyter lab version >2.0.
Installation for Jupyter notebook
First, install and enable bdgenomics.mango.pileup, a Jupyter Widget:
pip install bdgenomics.mango.pileup

jupyter nbextension install --py --user bdgenomics.mango.pileup
jupyter nbextension install --py --user widgetsnbextension

jupyter nbextension enable --py --user widgetsnbextension
jupyter nbextension enable --py --user bdgenomics.mango.pileup
Note: If you are using an conda environment, install extensions using --sys-prefix:
jupyter nbextension install --py --sys-prefix bdgenomics.mango.pileup
jupyter nbextension install --py --sys-prefix widgetsnbextension

jupyter nbextension enable --py --sys-prefix widgetsnbextension
jupyter nbextension enable --py --sys-prefix bdgenomics.mango.pileup
This will install the bdgenomics.mango.pileup extension into your current conda environment.
Installation for Jupyter lab
To use the Mango widgets in Jupyter lab, you will need the following requirements:
pip install bdgenomics.mango.pileup
jupyter labextension install @jupyter-widgets/jupyterlab-manager # install the Jupyter widgets extension
jupyter labextension install bdgenomics.mango.pileup
These tutorials show how to create a Jupyter pileup.js widget. An example notebook can be found in the Mango Github repository.
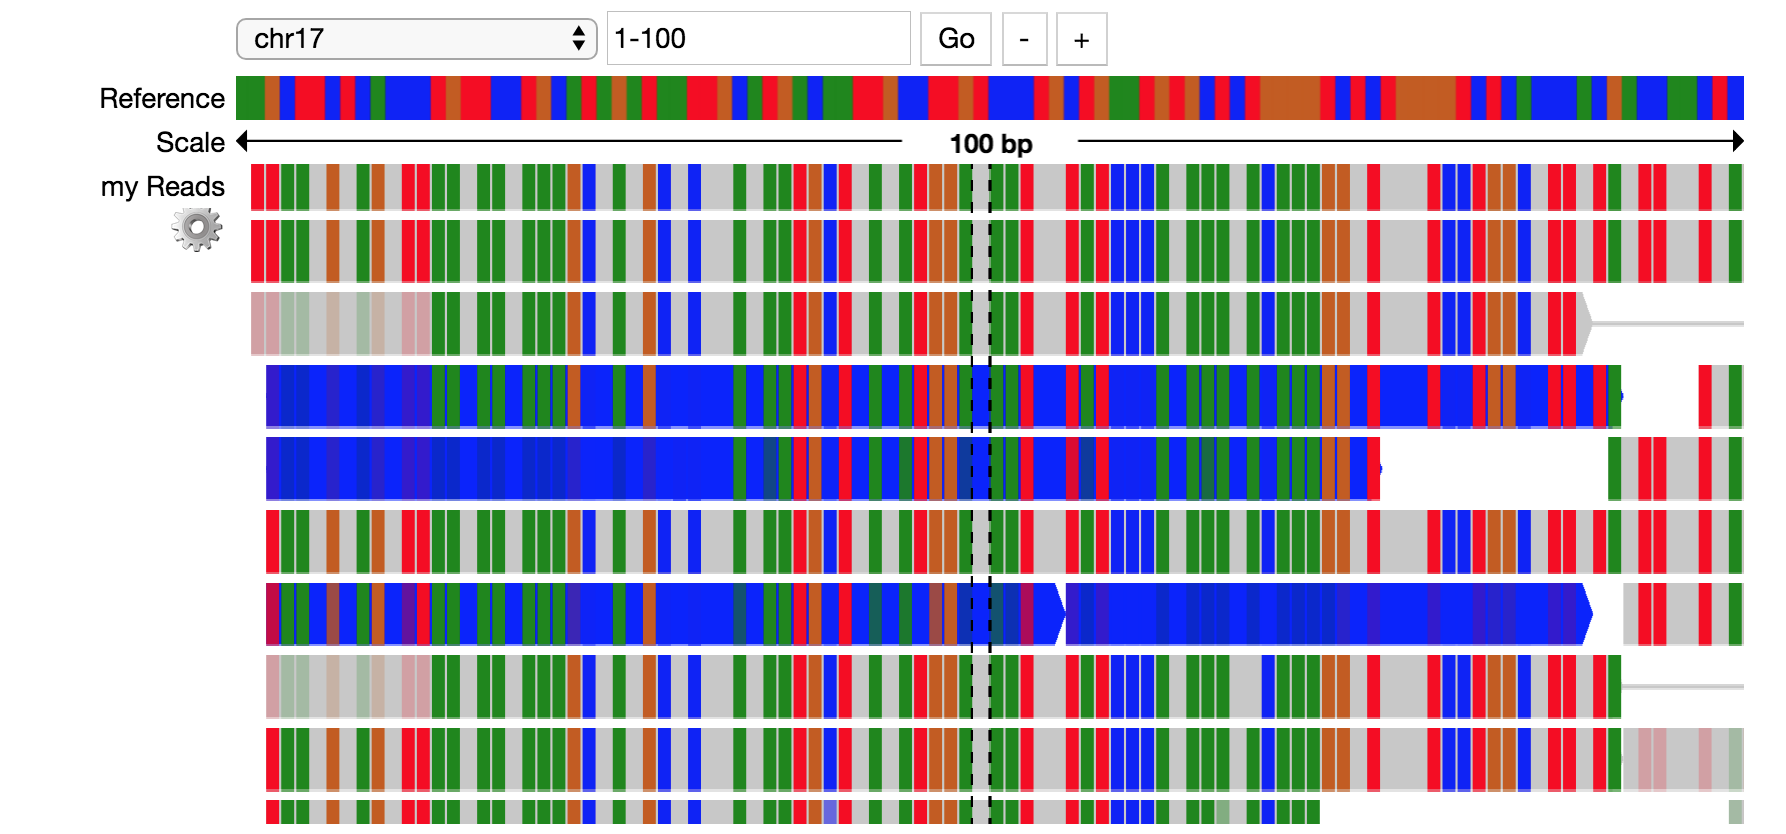
Pileup Example
This example shows how to visualize alignments through a Jupyter widget.
# imports
import bdgenomics.mango.pileup as pileup
from bdgenomics.mango.pileup.track import *
import pandas as pd
# read in JSON
readsJson = pd.read_json("./data/alignments.ga4gh.chr17.1-250.json")
GA4GHAlignmentJson = readsJson.to_json()

# make pileup track
tracks=[Track(viz="pileup", label="my Reads", source=pileup.sources.GA4GHAlignmentJson(GA4GHAlignmentJson))]

# render tracks in widget
reads = pileup.PileupViewer(chrom="chr17", start=1, stop=100, reference="hg19", tracks=tracks)
reads
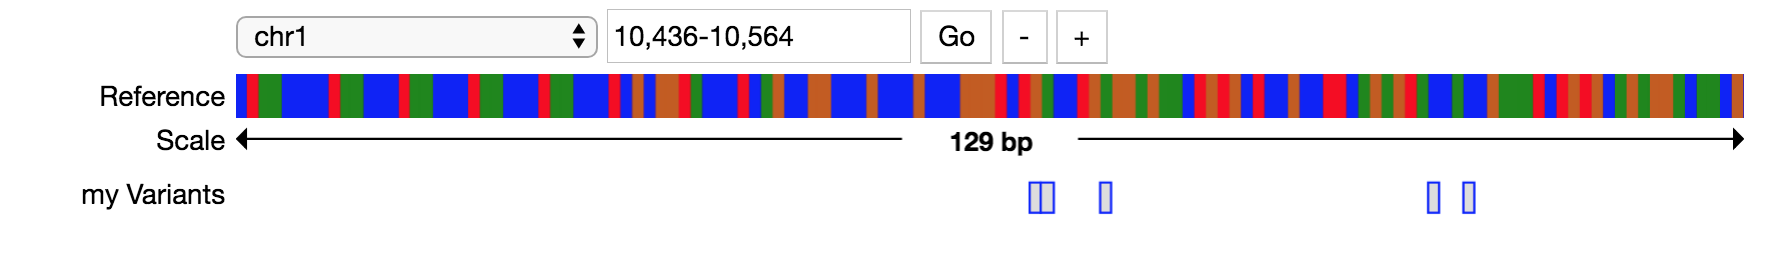
Variant Example
This example shows how to visualize variants through a Jupyter widget.
# make variant track
tracks=[Track(viz="variants", label="my Variants", source=pileup.sources.VcfDataSource("<path_to_file>/my_vcf.vcf"))]

# render tracks in widget
variants = pileup.PileupViewer(chrom="chr1", start=10436, stop=10564, reference="hg19", tracks=tracks)
variants
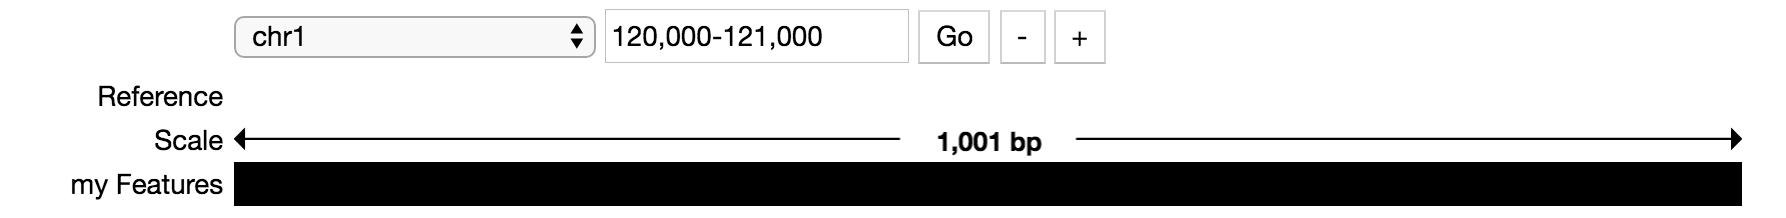
Feature Example
This example shows how to visualize features through a Jupyter widget.
featuresJson = pd.read_json("./data/features.ga4gh.chr1.120000-125000.json")
GA4GHFeatureJson = featuresJson.to_json()

# make feature track
tracks=[Track(viz="features", label="my Features", source=pileup.sources.GA4GHFeatureJson(GA4GHFeatureJson))]

# render tracks in widget
features = pileup.PileupViewer(chrom="chr1", start=120000, stop=121000, reference="hg19", tracks=tracks)
features
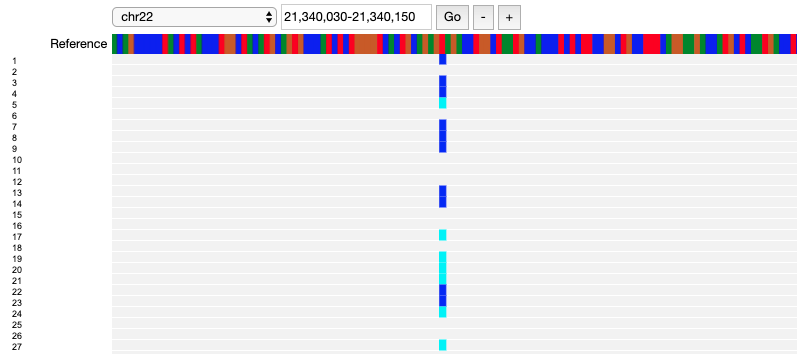
Genotype Example
This example shows how to visualize genotypes through a Jupyter widget.
# make genotype track
tracks=[Track(viz="genotypes", label="my Genotypes", source=pileup.sources.VcfDataSource("<path_to_file>/my_vcf.vcf"))]

# render tracks in widget
genotypes = pileup.PileupViewer(chrom="chr22", start=21340030, stop=21340150, reference="hg19", tracks=tracks)
genotypes